| Contents | ||
Even well respected JVMs will exhibit memory exhaustion or
performance degradation if the application's memory management
is not properly addressed. One aspect of Java memory management,
GC patterns, can be examined through a tracing
option called verbosegc.
This option is often enabled through a JVM command-line parameter
like -verbosegc .
Once verbosegc has been enabled, GC events will be written to the system error stream. This stream of data may also contain other information unrelated to verbosegc. Each stanza written by verbosegc will include information such as
There are usually other bits of information that are useful to know. The size of the trace and volume of GC data can be overwhelming. The GCA tool was written to manage the information in large verbosegc traces.
Summary First GC time: Wed, Feb 09, 08:43:40 PST Last GC time: Wed, Feb 09, 12:34:11 PST Total GCs: 395 Total GC Time: 27571 msec Average GC Time: 69 msec Percent GC Time: 0% Compactions: 3 Max GC time: 112 msec on Wed Feb 09 10:49:48 PST 2005 |
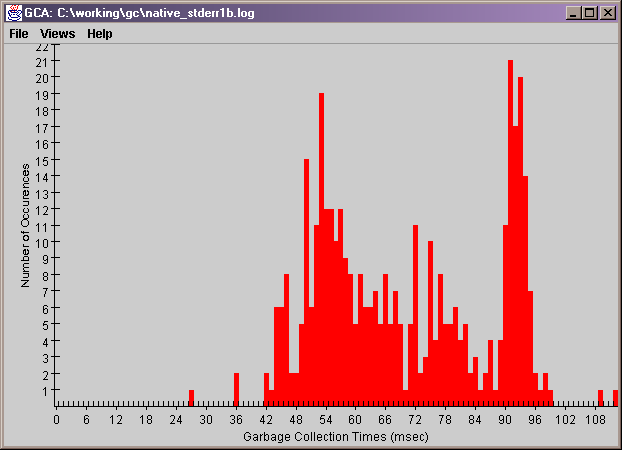
A histogram from the same sample run looks like
The command-line invocation that generated these views was
java -jar gca.jar progs/perl/gc/defaulterr.log ibm131
A Main-Class entry in the gca.jar
manifest will find and execute the main method.
The first argument is the name of the file containing the
verbosegc output. The second argument is the name of the
JVM. It is important to get his right since different JVMs
format their verbosegc differently. At this time, only the
following JVMs are supported.
More will follow shortly. No bias is intended against Sun JDKs. I just don't have any installed on my system at the moment. In the interest of getting this tool out quickly, I opted to post it with only the above two JVMs.
An alternative is to invoke the program with a single argument indicating the GUI choice.
java -jar gca.jar swingPresently, the only choice available is "swing". Once the GUI starts, you will have to use the menu items to load the trace and select a view.
java -jar gca.jar <parameters>
where <parameters> are described
below.
The JAR file manifest contains the required classpath entries
relative to gca.jar. So no CLASSPATH setting is
needed. Just leave the JARs in the location in which they
were unzipped.
gca.jar manifest so that it
can be executed with the following command:
java -jar gca.jar <parameters>If no parameters are present, a usage summary is printed to the command window.
If only one parameter is present, it is interpreted
as the GUI type. Presently, the only GUI type supported is
"swing". The only other planned GUI type is
"swt".
If two parameters are present, the first one is interpreted as the filename containing the verbosegc output. The second parameter is is interpreted as the jvm type. One has to know what the supported JVM types are to use this successfully. For this reason, the one parameter incantation is preferred in most cases.
When GCA is started as
java -jar gca.jar swingthe user is presented with an initially empty window. The first step is to read some verbosegc data. This is done with the File -> Open menu selection.
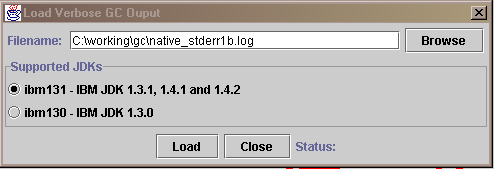
There is an entry field for the filename and a selection box for the JDK type. Once both filename and JDK type have been choosen, click Load to parse verbosegc file. When the staus message indicates it is finished, click Close.
Once the raw verbosegc data has been loaded, select the view in which to display the data. The choices of views are available under the Views menu. To view additional traces, select File -> Open to specify a new verbosegc trace.
You can also provide the GC file and JVM type on the command line.
java -jar gca.jar <filename> <jvm>
where <filename> is the absolute filename containing verbosegc output and <jvm> is one of the JVM strings listed above.
Thus it is a good practice to copy the verbose GC output to a focus file and delete all the entries that do not concern the test. Even the JVM start-up and idle time until the test begins will dilute the results. This is demonstrated in the sample output displayed above. GC records from all but one test were pruned. But the time between the JVM start-up until the actual testing began was several hours. This skewed the Percent GC Time. It shows 0% because there was less than 28 seconds of GC over a period of almost 4 hours. But the test itself only ran for less than an hour. It is for this reason that the first and last GC times are now listed in the Text View.